There's been one little error in UAH's new data for the lower troposphere -- the baseline (1981-2010) for the global lower troposphere didn't have an average anomaly of zero. That's pretty trivial.
It's being fixed. The data is a beta version, after all. This is why you put it out there
But this raises a larger question. How can we trust any dataset that's put out there -- not just UAH's, but any and all of them, dozens if not hundreds?
The algorithms now are so complex that to be sure -- really sure -- I'd have to acquire the raw data, construct a data model (algorithm), and run it. Obviously I cannot do this, likely even if I had the time, certainly not for 99% of the data out there, and you can't either.
If I had to guess, I would say that none of the datasets is exactly right. All of them will contain errors. The big errors are easy to catch, because they're big, but anyone who's ever coded and worked with data knows there is the possibility of a zillions of little errors where your computer spits out numbers and that makes you happy.
At some point, when you get results that look plausible -- no obvious errors, lots of internal checks, reasonable agreement with other work (if there is such) -- you stop and say, here are my results. But judgement necessarily includes your own biases -- you simply cannot help it. But that doesn't mean there are no more errors.
It'd be wonderful if there were observations or experimental results to compare to. But that's very rare, and if such data did exist, you'd have checked yourself and not published it if there wasn't agreement.
This is a big problem in science, or in any field that does data analysis, especially when the science has public implications. We all believe the data we think supports our views, and have to struggle mightily to deal with data that doesn't. But it is always going to involve trust, and past results, and reputations, and more.
So when I point out some big changes in UAH's dataset, I really have no idea whether their version 6.0beta is better than v5.6 or now. It agrees better with RSS, so that's a strong point in its favor. On the other hand, some of its corrections are greater than 1 C, which is bigger than the warming expected since the start of their dataset.
Science moves a lot slower than public opinion. That should be a good thing, except in an environment like today's.
Thursday, April 30, 2015
Not Something to Be Skinned
"We have gotten past the stage, my fellow-citizens, when we are to
be pardoned if we treat any part of our country as something to be skinned for two or three years for the use of the present generation, whether it is the forest, the water, the scenery. Whatever it is, handle it so that your children’s children will get the benefit of it."
-- Teddy Roosevelt, Grand Canyon, May 6, 1903

Wednesday, April 29, 2015
Estimated GISS April Global Temperature Anomaly: +0.66°C
My estimate for GISS's global temperature anomaly for April is +0.66°C.
This is based on the daily reanalysis numbers published by the University of Maine Climate Reanalyzer, as described here. This makes April significantly cooler than March's +0.84°C, but it's still the 4th-warmest April since record-keeping began in 1880.
Year-to-date, i.e. for [only] he first four months of this year, this puts GISS at +0.13°C warmer than 2014. Assuming my estimate for April is correct, GISS only needs an average anomaly of +0.63°C for the rest of the year to establish a new record:

Reminder: GISS's baseline is 1951-1980.
I also estimate HadSST's April anomaly will be +0.40°C, which is the 4th-warmest April since 1850.
The Reanalyzer shows the El Nino really gaining steam (so to speak), which suggests a likelihood of warmer months ahead:

This is based on the daily reanalysis numbers published by the University of Maine Climate Reanalyzer, as described here. This makes April significantly cooler than March's +0.84°C, but it's still the 4th-warmest April since record-keeping began in 1880.
Year-to-date, i.e. for [only] he first four months of this year, this puts GISS at +0.13°C warmer than 2014. Assuming my estimate for April is correct, GISS only needs an average anomaly of +0.63°C for the rest of the year to establish a new record:
Reminder: GISS's baseline is 1951-1980.
I also estimate HadSST's April anomaly will be +0.40°C, which is the 4th-warmest April since 1850.
The Reanalyzer shows the El Nino really gaining steam (so to speak), which suggests a likelihood of warmer months ahead:
Remarkable Changes to UAH Data
A few more thoughts about the new UAH datasets (version 6.0, beta).
UAH calculates anomalies for 27 regions, of which some are subsets of a larger region.
Their dataset goes back 36.3 years. The period starting in December 1978, going to March 2015, consists of 11,772 data points.
All those data points get changed in the new dataset, v6.0 beta, from version 5.6.
Of those changes, 29 have a value greater than 1.0 C or less than -1.0 C.
Of those changes, 410 are greater than 0.5 C or less than -0.5 C -- that's 3.5% of their data points.
I find that pretty remarkable. And yet the usual suspects will swallow this without questioning it at all, and be thankful for it.
Some Big Adjustments to UAH's Dataset
The UAH group has released version 6.0beta of their temperature anomalies, doing an extensive rethinking and rewriting of their algorithm and code. It looks like a huge amount of work. You can read all about it (and should) at Roy Spencer's site.
.jpg)
The upshot is that the global trend for the lower troposphere decreases from 0.14°C/decade to 0.11°C/decade. That's over all 36.3 years of the record.
The new version is a beta version, so naturally there may be some kinks to work out. To far, there are some surprising large changes in both directions. (I'll only look at the lower troposphere, since that's of most populat interest.)
Here is their graph of the changes, for the monthly global numbers only:

Here is their graph of the changes, for the monthly global numbers only:
First, here are the data:
old: UAH LT v5.6
new: UAH LT v6.0beta
Here are the comparisions, for each region. I've highlighted what seem to me to be surprisingly big increases, and in blue suprisingly big decreases.
Yes, some months change by more than 1°C -- the largest decrease of any month is -1.43°C, in the Arctic. +1.32°C for the Arctic Ocean.
Here are the monthly changes for the North Pole (60°N - 90°N):

Here are the monthly changes for the North Pole (60°N - 90°N):
The two most extreme changes are
+1.32 C for the North Pole ocean in Jan 1981.
-1.43 C for North Pole land in Nov 2003.
Many of the largest changes are from decades ago:
+1.32 C for the North Pole ocean in Jan 1981.
-1.43 C for North Pole land in Nov 2003.
Many of the largest changes are from decades ago:
A change of +0.83 C for USA48 in 1/1979
A change of +0.85 C for USA49 in 2/1979
A change of -0.76 C for AUST in 12/1978
A change of -1.31 C for SoPol_Land in 9/1982
But even some recent changes are quite large:
A change of -0.31 C for NH_Ocean in 12/2014
A change of -1.40 C for NoPol_Ocean in 3/2010, and
A change of -1.25 C for NoPol_Ocean for 2/2010
A change of -0.71 C for USA48 in 2/2009
I'm not saying there is anything wrong or untoward about these changes -- I have to trust the UAH group, just like I have to trust GISS, HadCRUT4, Cowtan & Way, etc. Of course, UAH's work needs to be published and peer reviewed, just like all the others.
This will be a litmus test for contrarians. Can you imagine the howling if GISS changed a past month by +1.32°C? Unfortunately, I expect they will convince themselves these changes are good, but adjustments to the surface dataset are not. In fact, they already are.
This will be a litmus test for contrarians. Can you imagine the howling if GISS changed a past month by +1.32°C? Unfortunately, I expect they will convince themselves these changes are good, but adjustments to the surface dataset are not. In fact, they already are.
Tuesday, April 28, 2015
Calbuco Volcano Not Likely to Affect Global Temperature
 |
| Calbuco eruption |
By contrast, in 1991 Mount Pinatubo emitted 17 million tons of SO2, and that cooled the globe about 0.4°C from 1991 to 1993.
The NASA article says
The SO2 total is much lower than the recent Holuhraun eruption [August 29, 2014], which released about 11–12 [million tons], or 30 to 40 times more than Calbuco. “But the SO2 from Holuhraun was emitted over several months and was mostly confined to the lower troposphere, limiting its climate impacts,” [Simon] Carn noted. “In terms of climate impacts, Calbuco is probably more significant due to the stratospheric SO2 injection.”So unless there are more massive eruptions in its near future, Calbuco doens't look likely to impact global temperatures. But
“Although a single eruption of this size is unlikely to have a measurable effect on climate,” Carn added, “recent work suggests that the cumulative effects of multiple volcanic eruptions of this size in the past decade may have slowed the rate of global warming due to the stratospheric sulfate aerosols produced.”
Sunday, April 26, 2015
Friday, April 24, 2015
A Surprising Temperature Reconstruction, 100-2000 A.D.
There's a surprising paper in Geo Rev Letters, presenting this reconstruction of surface temperatures over the last 2000 years. I've taken the data and calculated its 10-year moving average:

Not surprisingly, it finds a warm Roman period, but then the reconstruction shows a dip in temperatures during the Medieval Climate Anomaly (MCA) of 1000-1200 AD. Then mild temperatures, then a sharp dip into the Little Ice Age, and strong warming since 1850 and the Industrial Revolution.
Not too surprising, except for the MCA. How did that come about?
Well, in fact it did not come about. Actually, this data consists of nothing but random numbers that I generated, between 0 and 1, one per year, with their 10-year moving average plotted above.
How do random numbers give a realistic looking temperature time series?
It's called the Slutsky Effect, which I just learned about from an article John Fleck sent me a few weeks ago:
Eugen Slutsky (1880-1948) was a Russian mathematician who did important work in economics and in the mathematics of time series, while trying to keep his head on his shoulders during the Russian revolution and the murdering afterward.
Slutsky showed that it's very easy to construct random times series that appear, when a moving average is calculated, to give results very reminiscent of economic business cycles. Here is a nice overview.
Or, here, a temperature time series.
The random data I generated, between 0 and 1, has an average of 0.490 and a standard deviation of 0.025.
Its trend from start to finish is -0.000003 -- essentially zero. Yet it shows what could easily be interpreted as meaningful intervals of warm and cold.
Kelly and Ó Gráda look at temperature reconstructions in Europe from 1300-2000, calculated 25-year moving averages, and find the following:

which looks meaningful, except it comes from this raw data, whose trend isn't statistically different from zero:

They've done more statistical analysis in a paper in the Annals of Applied Statistics, which I have not yet read but plan to.
So what to make of this?
I'm not sure. Patterns can be found in random data, that look meaningful. A series of random events can combine to look like a meaningful cycles in an economy, or a climate.
Is this all that modern global warming is, a time series analyzed so as to look meaningful? No, because its trend is statistically different from 0.
But other data? I think the lesson is you need to be careful. Kelly and Ó Gráda conclude there was no Little Ice Age, in a statistical meaningful sense. There were, to be sure, decades of worse weather than normal, that affected crop production in regions and the people who depended on them.
But a widespread LIA? They say no.
More later.
Not surprisingly, it finds a warm Roman period, but then the reconstruction shows a dip in temperatures during the Medieval Climate Anomaly (MCA) of 1000-1200 AD. Then mild temperatures, then a sharp dip into the Little Ice Age, and strong warming since 1850 and the Industrial Revolution.
Not too surprising, except for the MCA. How did that come about?
--
Well, in fact it did not come about. Actually, this data consists of nothing but random numbers that I generated, between 0 and 1, one per year, with their 10-year moving average plotted above.
How do random numbers give a realistic looking temperature time series?
It's called the Slutsky Effect, which I just learned about from an article John Fleck sent me a few weeks ago:
"The myth of Europe’s Little Ice Age"
Morgan Kelly, Cormac Ó Gráda, 28 March 2015
Eugen Slutsky (1880-1948) was a Russian mathematician who did important work in economics and in the mathematics of time series, while trying to keep his head on his shoulders during the Russian revolution and the murdering afterward.
Slutsky showed that it's very easy to construct random times series that appear, when a moving average is calculated, to give results very reminiscent of economic business cycles. Here is a nice overview.
Or, here, a temperature time series.
The random data I generated, between 0 and 1, has an average of 0.490 and a standard deviation of 0.025.
Its trend from start to finish is -0.000003 -- essentially zero. Yet it shows what could easily be interpreted as meaningful intervals of warm and cold.
Kelly and Ó Gráda look at temperature reconstructions in Europe from 1300-2000, calculated 25-year moving averages, and find the following:
which looks meaningful, except it comes from this raw data, whose trend isn't statistically different from zero:
They've done more statistical analysis in a paper in the Annals of Applied Statistics, which I have not yet read but plan to.
So what to make of this?
I'm not sure. Patterns can be found in random data, that look meaningful. A series of random events can combine to look like a meaningful cycles in an economy, or a climate.
Is this all that modern global warming is, a time series analyzed so as to look meaningful? No, because its trend is statistically different from 0.
But other data? I think the lesson is you need to be careful. Kelly and Ó Gráda conclude there was no Little Ice Age, in a statistical meaningful sense. There were, to be sure, decades of worse weather than normal, that affected crop production in regions and the people who depended on them.
But a widespread LIA? They say no.
More later.
For me this glass is already broken.
"You see this goblet?" asks Achaan Chaa, the Thai meditation master. "For me this glass is already broken. I enjoy it; I drink out of it. It holds my water admirably, sometimes even reflecting the sun in beautiful patterns. If I should tap it, it has a lovely ring to it. But when I put this glass on the shelf and the wind knocks it over or my elbow brushes it off the table and it falls to the ground and shatters, I say, 'Of course.' When I understand that the glass is already broken, every moment with it is precious."via Kottke.org

Tuesday, April 21, 2015
Is it Fair to Now Blame China for Climate Change?
Perhaps in advance of the Paris conference this December, a spate of articles came out in the last few days claiming that "China to surpass U.S. as top cause of modern global warming." Is that fair? (No.)

Yes, by this measure China will surpass the US by about 2016.
But, of course, the climate doesn't care about your silly accounting choices and conferences, it only knows how much CO2 is in the atmosphere. And the US has emitted a lot more CO2 over the last century than has China. Since 1900, the comparison comes out very nicely if you take the ratio of cumulative emissions:

That's not even to mention per capita emissions, which in 2014 were 16.9 tons CO2/person in the US and 7.2 tons CO2/person in China.

And in 2012, 16% of China's emissions went to products exported elsewhere (not sure of this number for the US).

Many like comparing national emissions, but it's not like an American has some exceptional right to emit CO2 that a Chinese citizen does not. We're the world's energy hogs, not them. And China's one-child policy probably did more to reduce emissions than all of the Kyoto Protocol.
(In James Hansen's book he writes that it's actually the UK that has the highest historical per capita emissions, but IIRC doesn't provide a source for that.)
So I don't think it's fair to start blaming China for global warming -- not even by 2025, when their cumulative emissions are projected to pass the US's (see above). But that seems like what some are trying to do already.

Figure via The Carbon Brief.
(Reuters) - China is poised to overtake the United States as the main cause of man-made global warming since 1990, the benchmark year for U.N.-led action, in a historic shift that may raise pressure on Beijing to act.and
China's cumulative greenhouse gas emissions since 1990, when governments were becoming aware of climate change, will outstrip those of the United States in 2015 or 2016, according to separate estimates by experts in Norway and the United States.
The shift, reflecting China's stellar economic growth, raises questions about historical blame for rising temperatures and more floods, desertification, heatwaves and sea level rise.
"A few years ago China's per capita emissions were low, its historical responsibility was low. That's changing fast," said Glen Peters of the Center for International Climate and Environmental Research, Oslo (CICERO), who says China will overtake the United States this year.Here's data on US and China cumulative emissions since 1990:
Yes, by this measure China will surpass the US by about 2016.
But, of course, the climate doesn't care about your silly accounting choices and conferences, it only knows how much CO2 is in the atmosphere. And the US has emitted a lot more CO2 over the last century than has China. Since 1900, the comparison comes out very nicely if you take the ratio of cumulative emissions:
CO2 emissions data:
1900-2004 from World Resources Institute
2005-2012 from EIA
2013 from the Carbon Atlas Project
2014 from the EIA (for the US) and reported percentage increase in China (-2.0% compared to 2013).
That's not even to mention per capita emissions, which in 2014 were 16.9 tons CO2/person in the US and 7.2 tons CO2/person in China.
And in 2012, 16% of China's emissions went to products exported elsewhere (not sure of this number for the US).
Many like comparing national emissions, but it's not like an American has some exceptional right to emit CO2 that a Chinese citizen does not. We're the world's energy hogs, not them. And China's one-child policy probably did more to reduce emissions than all of the Kyoto Protocol.
(In James Hansen's book he writes that it's actually the UK that has the highest historical per capita emissions, but IIRC doesn't provide a source for that.)
So I don't think it's fair to start blaming China for global warming -- not even by 2025, when their cumulative emissions are projected to pass the US's (see above). But that seems like what some are trying to do already.
Figure via The Carbon Brief.
Saturday, April 18, 2015
More About Cumulative Warming, Models versus Observations
This is more about how well (or not) climate models predict/project the total warming that's been seen so far.
After I put up this graph of a GISS model's cumulative warming versus observations, a couple of people said "but it's just one model." Fair enough. It happened to be the first model I looked at, because I'd been reading a paper about it.
The same CMIP5 page also has a data file for an ensemble of 21 model -- presumably, the "best" ones, the biggest ones, made by the big research groups. (All models aren't created equal, which makes one wonder about this Roy Spencer graph with an average of 90 models. More about that graph at HotWhopper.)
Here's the result for the total warming from 1860 to 2014:

C&W is Cowtan and Way. Again, by "total warming" I mean (linear slope)*(time interval). (Not perfect, but what would be better? Maybe average_of_last_30_years - average_of_first_30_years. Maybe I'll try that later.)
So, the agreement is pretty good. The deviation between the ensemble mean and Cowtan & Way starts around 2005, and is now up to 0.07°C. There's your slowdown.
If I was Stephen Koonin, I would say the model error is only 0.07 K/288 K = 0.02%. But I'm not, so I won't.
Instead, it's about 0.07 K/0.94 K = 7%, over a century and a half.
So how good does a model need to be?
After I put up this graph of a GISS model's cumulative warming versus observations, a couple of people said "but it's just one model." Fair enough. It happened to be the first model I looked at, because I'd been reading a paper about it.
The same CMIP5 page also has a data file for an ensemble of 21 model -- presumably, the "best" ones, the biggest ones, made by the big research groups. (All models aren't created equal, which makes one wonder about this Roy Spencer graph with an average of 90 models. More about that graph at HotWhopper.)
Here's the result for the total warming from 1860 to 2014:
C&W is Cowtan and Way. Again, by "total warming" I mean (linear slope)*(time interval). (Not perfect, but what would be better? Maybe average_of_last_30_years - average_of_first_30_years. Maybe I'll try that later.)
So, the agreement is pretty good. The deviation between the ensemble mean and Cowtan & Way starts around 2005, and is now up to 0.07°C. There's your slowdown.
If I was Stephen Koonin, I would say the model error is only 0.07 K/288 K = 0.02%. But I'm not, so I won't.
Instead, it's about 0.07 K/0.94 K = 7%, over a century and a half.
So how good does a model need to be?
Friday, April 17, 2015
NOAA Gets Warmer
NOAA found the average global temperature anomaly for March to be the warmest for any March in their records, and the third-warmest of any month since 1880 (after only the tie between Feb 1998 and Jan 2007).
Here's how warm it's been in recent months: NOAA's record year was also 2014, with an average anomaly of +0.69°C. For this year to match that record, the rest of 2015 has only to average +0.65°C, which is 0.17°C below what's it's averaged so far.

Note: NOAA uses a baseline of 1901-2000, so their numbers aren't directly comparable to GISS (1951-1980) or HadCRUT4 (1961-1990). But trends are directly comparable, as are differences between months.
Here's how warm it's been in recent months: NOAA's record year was also 2014, with an average anomaly of +0.69°C. For this year to match that record, the rest of 2015 has only to average +0.65°C, which is 0.17°C below what's it's averaged so far.
Note: NOAA uses a baseline of 1901-2000, so their numbers aren't directly comparable to GISS (1951-1980) or HadCRUT4 (1961-1990). But trends are directly comparable, as are differences between months.
Thursday, April 16, 2015

Tuesday, April 14, 2015
See Steyn Lie
In another post by a climate expert, Mark Steyn writes:
Blatantly, it ignores ocean warming, the best of all indicators of global warming. (As they say, it's called "global warming," not "surface warming" and not "only-RSS-and-no-other-datasets-allowed warming.")
The correct statement is:
So let's look at NASA GISS's temperature anomaly since Jan 1997:

Or this, showing the last 12 months are the warmest such period in GISS's records:


"As I've said before, if you graduated from college last summer, there's been no "global warming" since you were in kindergarten."This is getting so bad now this can only be called what it is: a lie. Purposeful deceit. Scientific fiction.
Blatantly, it ignores ocean warming, the best of all indicators of global warming. (As they say, it's called "global warming," not "surface warming" and not "only-RSS-and-no-other-datasets-allowed warming.")
The correct statement is:
If you graduated from college last summer, you've just lived through the warmest 12 months of your life. And of your parents' lives, and your grandparents' too.I hesitate to confuse Steyn with numbers, but... assuming one is 5 years old in kindergarten, and 22 when they graduated college last summer (so most people would be 23 at this piont), that's the cherry picked "18 years."
So let's look at NASA GISS's temperature anomaly since Jan 1997:
Or this, showing the last 12 months are the warmest such period in GISS's records:
Of course, those looking to fool others like to pretend the only data that exists anywhere in the world is from RSS:
while completely ignoring the other data that measures the same thing, but which has better coverage of the globe (UAH misses 0.9% of Earth's surface; RSS misses 6.9%).
I won't even get into error bars and statistical significance and all that -- it would pass through Steyn as just more dark energy. Or Cowtan and Way (trend of +0.11 C over 18 years.) Or ocean warming, the best of all indicators of global warming. Or the role of natural variability, or that 18 years is too short to be indicative of climate change anyway.
The liars like Mark Steyn don't want to hear anything about all that. Climate science is, for him, just another thing to hate on, another faucet for his bile.

NASA GISS: March was 5th Warmest Month in Their Record
GISS's March anomaly was +0.84°C, the 5th warmest (most anomalous) month since 1880.
It was the 3rd warmest March. The Northern Hemisphere (+1.17°C) was the warmest March in the records, and the second-highest of any month in the NH.
My guess (+0.86°C) was again pretty good.
Recent temperatures are climbing, and now approach the peak of the 1997-98 El Nino:
April 2015, however, is looking like it will have a signficant anomaly drop of perhaps 0.2°C - 0.3°C, based on the first half of the month. More on that later.
It was the 3rd warmest March. The Northern Hemisphere (+1.17°C) was the warmest March in the records, and the second-highest of any month in the NH.
My guess (+0.86°C) was again pretty good.
Recent temperatures are climbing, and now approach the peak of the 1997-98 El Nino:
 |
| Nino3.4 anomaly on left-hand axis; GISTEMP anomaly on right-hand axis. |
April 2015, however, is looking like it will have a signficant anomaly drop of perhaps 0.2°C - 0.3°C, based on the first half of the month. More on that later.
Monday, April 13, 2015
Velella velella Wash Up on Oregon Shores

Thursday, April 09, 2015
On "Is Climate Change Making Us Stupid?"
Two things caught my eye tonight. One was this Tweet by Roger Pielke Sr
motivated by this post by Judith Curry, "Climate change availability cascade," where she concludes
Personally, I'm getting very tired of being called stupid, hearing people called stupid, hearing scientists called stupid, and the media, and advocates, and Barack Obama, and the left as a whole. I'm getting tired of hearing that the scientific process has been "corrupted."
I'm getting tiring of hearing people, especially certain scientists, whine about “politically correct orthodoxy,” that there's no ability to think rationally (besides the ones making the claim, of course), that scientists are climate zombies, that the fix is in. It sounds like what it is -- nothing more than an excuse because these scientists' own ideas aren’t being widely accepted, their op-eds aren't convincing, they're not winning the debate, their science isn't more convincing. That's playing politics, the very thing they claim to see in others. And it’s playing the victim, which is always kinda pathetic.
It’s very simple for these scientists to fix the situation they're complaining about — provide better evidence. Put forth better science. Gather data and write papers than convinces others your ideas have merit, that what you’re claiming is real and right and that a different viewpoint is therefore required -- required because that’s what your evidence shows and your science says, not because you wrote some polemic on your blog or on Twitter.
Better evidence has always prevailed in science -- in fact, it's the only thing that ever has -- which is the real story of those peptic ulcers.
But stop maligning scientists as a group, stop whining they’re suppressing ideas, that the game is rigged, that those who accept the seriousness of AGW position are climate zombies. Stop saying everyone (besides you) is doing it just for the grant money, except for all the secret people you know who all support your position but they're too afraid to come out and say so because they have a mortgage.
Science is, and always has been, a battle of ideas, and not all ideas are created equal and not all ideas prevail. I'm not a scientist, but it seems to me you have to fight for your ideas, fight hard, but fight honorably, and if you don't win a battle, turn around and get up and head back in, but don't complain endlessly that the other side is cheating. They're not cheating. They're not stupid. They're not corrupt. And you're not fooling anybody.
"Is climate change making us stupid? I fear that the answer is ‘yes’" http://t.co/QpTy4j59nc …
It has also corrupted the scientific process
— Roger A. Pielke Sr (@RogerAPielkeSr) April 10, 2015
Is climate change making us stupid? I fear that the answer is ‘yes.’ This problem is exacerbated by politically correct climate change orthodoxy, enforced by politicians, advocates and the media in an availability cascade, which is destroying our ability to think rationally about how we should respond to climate change. As a result, we have created a political log-jam over this issue, with scientists caught in the cross-fire.Most scientists are caught in the cross-fire. But some are doing the shooting. (And, no, I'm not naive enough to think the bullets are only going in one direction, either, but I do see an asymmetry.)
Personally, I'm getting very tired of being called stupid, hearing people called stupid, hearing scientists called stupid, and the media, and advocates, and Barack Obama, and the left as a whole. I'm getting tired of hearing that the scientific process has been "corrupted."
I'm getting tiring of hearing people, especially certain scientists, whine about “politically correct orthodoxy,” that there's no ability to think rationally (besides the ones making the claim, of course), that scientists are climate zombies, that the fix is in. It sounds like what it is -- nothing more than an excuse because these scientists' own ideas aren’t being widely accepted, their op-eds aren't convincing, they're not winning the debate, their science isn't more convincing. That's playing politics, the very thing they claim to see in others. And it’s playing the victim, which is always kinda pathetic.
It’s very simple for these scientists to fix the situation they're complaining about — provide better evidence. Put forth better science. Gather data and write papers than convinces others your ideas have merit, that what you’re claiming is real and right and that a different viewpoint is therefore required -- required because that’s what your evidence shows and your science says, not because you wrote some polemic on your blog or on Twitter.
Better evidence has always prevailed in science -- in fact, it's the only thing that ever has -- which is the real story of those peptic ulcers.
But stop maligning scientists as a group, stop whining they’re suppressing ideas, that the game is rigged, that those who accept the seriousness of AGW position are climate zombies. Stop saying everyone (besides you) is doing it just for the grant money, except for all the secret people you know who all support your position but they're too afraid to come out and say so because they have a mortgage.
Science is, and always has been, a battle of ideas, and not all ideas are created equal and not all ideas prevail. I'm not a scientist, but it seems to me you have to fight for your ideas, fight hard, but fight honorably, and if you don't win a battle, turn around and get up and head back in, but don't complain endlessly that the other side is cheating. They're not cheating. They're not stupid. They're not corrupt. And you're not fooling anybody.
Wednesday, April 08, 2015
Discussion of How Global Warming Works
This is a post whose comments will be a discussion of things I'm discussing with someone on Twitter (to take it off Twitter and its character limitations).
Tuesday, April 07, 2015

Roy Spencer's Peptic Ulcers
Roy Spencer has a post up where he writes:
It seems that Spencer and Fulks think the peptic ulcer example shows that any and all consensus is science is wrong -- or, at least, the couple of consensuses they disagree with. (Perhaps it also means they think they deserve a Nobel Prize, as was shared by Marshall and Warren in 2005.)
If Roy Spencer or Gordon Fulks wants to disprove AGW, or show it's not a serious concern, they have to show why it's not a serious concern. With evidence and with science. That's all. But they can't simply refer to some historical scientific idea that was disproven as if it gives their claims about AGW any weight. It doesn't.
There is no disproof by proxy. If contrarians want to prevail in the debate, they need to produce evidence and science that is convincing. Not just convincing to them -- because it's too easy to fool oneself -- or to just their buddies who all live in the same bubble -- but convincing to the scientific community. That has worked in science since it began -- indeed, it's how the peptic ulcer claims themselves were corrected -- by hard work, better evidence, and superior science.
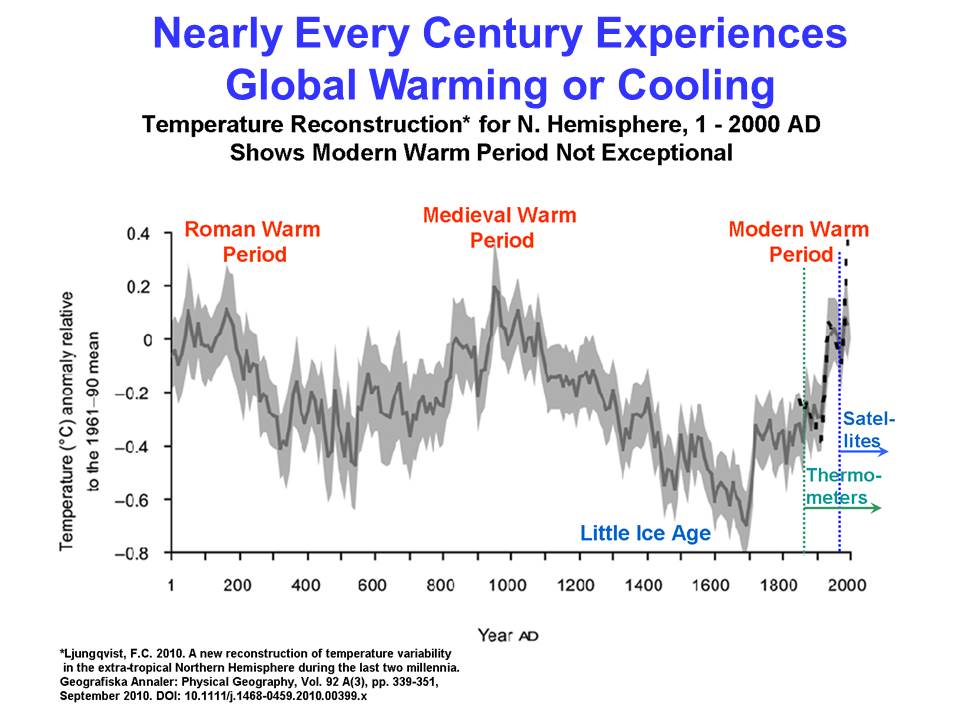
PS: And there's also this. In a recent post, Spencer puts up a graph he's titled himself, using the words "global warming or global cooling." But look at the fine print -- the graph is for the extra-tropical Northern Hemisphere. In fact, from the paper's abstract, it only pertains to the region from 30 N latitude. That's not the globe -- it's only one-quarter of the globe (25%)!
The title Spencer choose is misleading (at best.)
I see these kind of shenanigans again and again on his blog. He's certainly not going to disprove any theories of peptic ulcers with this kind of work.
"I prefer to compare us [John Christy and he] to Barry Marshall and Robin Warren, who rejected the scientific consensus that peptic ulcers were due to too much stress or spicy food."I hear this from contrarians a lot. It refers to the finding by Marshall and Warren that peptic ulcers weren't caused by stress or food, as was once thought, but by the bacterium Helicobacter pylori. It's also a favorite talking point of Oregon's resident climate denier, Gordon Fulks (here, here, here).
It seems that Spencer and Fulks think the peptic ulcer example shows that any and all consensus is science is wrong -- or, at least, the couple of consensuses they disagree with. (Perhaps it also means they think they deserve a Nobel Prize, as was shared by Marshall and Warren in 2005.)
If Roy Spencer or Gordon Fulks wants to disprove AGW, or show it's not a serious concern, they have to show why it's not a serious concern. With evidence and with science. That's all. But they can't simply refer to some historical scientific idea that was disproven as if it gives their claims about AGW any weight. It doesn't.
There is no disproof by proxy. If contrarians want to prevail in the debate, they need to produce evidence and science that is convincing. Not just convincing to them -- because it's too easy to fool oneself -- or to just their buddies who all live in the same bubble -- but convincing to the scientific community. That has worked in science since it began -- indeed, it's how the peptic ulcer claims themselves were corrected -- by hard work, better evidence, and superior science.
 |
| Graph (mis)titled by Roy Spencer |
PS: And there's also this. In a recent post, Spencer puts up a graph he's titled himself, using the words "global warming or global cooling." But look at the fine print -- the graph is for the extra-tropical Northern Hemisphere. In fact, from the paper's abstract, it only pertains to the region from 30 N latitude. That's not the globe -- it's only one-quarter of the globe (25%)!
The title Spencer choose is misleading (at best.)
I see these kind of shenanigans again and again on his blog. He's certainly not going to disprove any theories of peptic ulcers with this kind of work.
Wednesday, April 01, 2015
A GISS Model vs GISS Observed Warming
Total global warming since 1880 from GISS global annual average temperatures versus GISS-E2-R model results for RCP2.6:

Another March Prediction from Reanalysis Data
| Attention clip artists: The Web needs a picture like this, but with the Sun replaced by greenhouse gases (or at least carbon dioxide). They're invisible, so some cleverness will be required. I don't have any suggestions, except perhaps the Earth's outgoing infrared spectrum: http://www.giss.nasa.gov/research/briefs/schmidt_05/. |
Most of the NCEP data for March global surface temperature is in, and despite some cooling at the end, it still looks to be a little warmer than February. Probably less than May 2014, but higher than any other month in 2014 (or 2015). I'd expect this to be reflected in surface temps.
GISS's anomaly for February was +0.79°C, so my estimate of +0.86°C would qualify as "a little warmer." May 2014 was +0.78°C according to GISS, though September was even higher at +0.81°C.
If March meets my estimate, only three months would have been warmer hotter (according to GISS): January 2007, March 2002, and March 2010 (in order).
Subscribe to:
Posts (Atom)